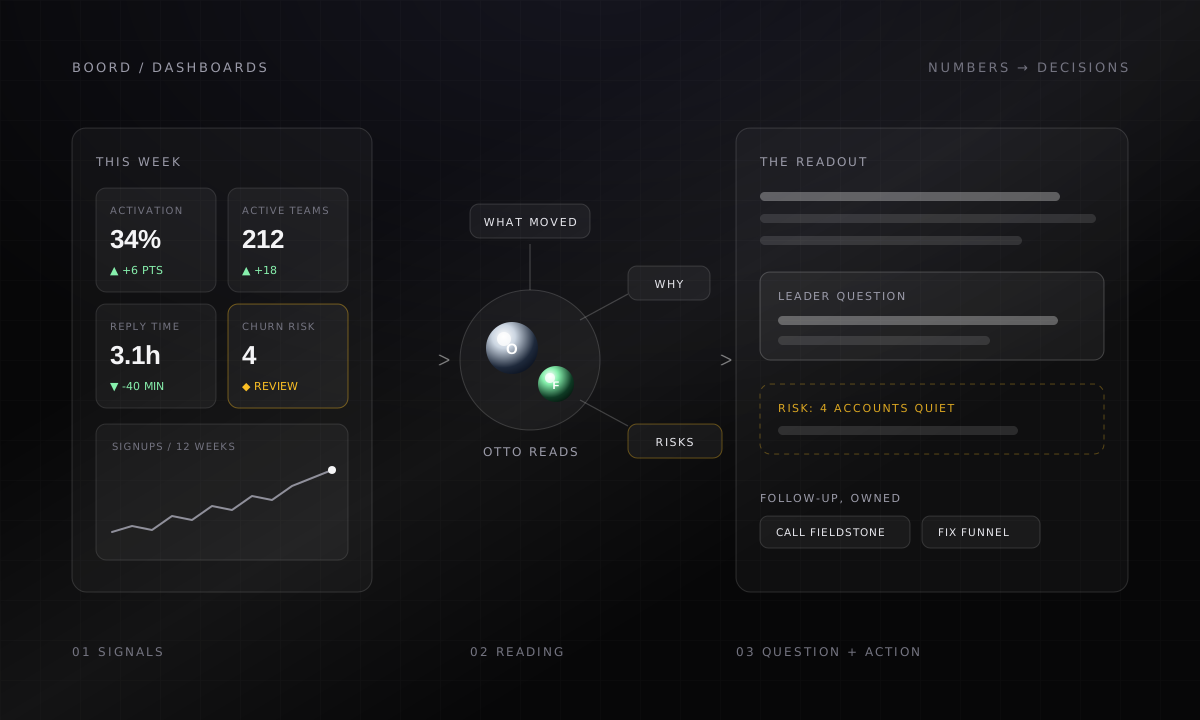
A dashboard is only useful when it changes a decision. Most dashboards do the opposite: they show forty numbers, imply nothing, and quietly train leaders to stop looking.
Boord treats the numbers as the start of a conversation. Otto reads the movement, Fugger weighs what it means for the business plan, and Roma turns the result into questions with owners. What you review is a readout, not a wall of charts.
Otto: Activation is up because the new onboarding flow ships context earlier. The quiet accounts worry me more than the wins: two of them went silent right after a support escalation.
Fictional numbers. The tiles are the summary; the narrative below them is the product.
What a readout contains
Every metric that moved gets the same treatment: the movement, the reason, the risk, and the action. Numbers that did not move and do not matter stay out of the way.
Movement
Which number changed, whether the direction is good, and what context explains it. In sentences, with the figures inline.
Risk
What might be fragile or misleading if you only read the chart: a metric propped up by one account, a streak about to lap an easy baseline.
Action
The owner, question, or next review that turns the reading into company work. A readout without an action is filed as context, not sent as noise.
The loop behind the readout
- Signals
The raw week
Connected metrics, spreadsheet notes, support threads, customer signals, and the operating question behind the review.
- Reading
Signal from noise
Otto names what moved and why it matters. Fugger checks the financial implication before it becomes advice.
Otto Fugger - Question
The leader answers
Each movement arrives as a question you can answer in one line: accept the risk, dig deeper, or change the plan.
Human decides - Action
Work leaves the review
Decisions and owners land where execution happens.
- Follow-up tasks with owners
- Risk notes on the board
- Updated weekly narrative
- Signals into Brain
Fugger joins whenever a movement touches the business plan; Roma turns the reading into the review agenda.
Ask the dashboard anything
The readout is a document, but the dashboard is a conversation. Anything in the narrative can be interrogated in chat, and the answer comes back with its sources.
What changed this week, and what should worry me?
Three things moved. Activation and reply time improved, both for explainable reasons. The worry is four accounts going quiet, and two of them follow the same pattern: silence right after an escalation.
- Refreshed the operating readout Done
- Flagged 2 accounts with the escalation pattern Done
- Draft check-in notes for both accounts Waiting for your approval
Illustrative exchange. Outgoing messages and board changes wait for approval.
The review discipline
The dashboard proposes; the leader disposes. Every reading that becomes action passes a human check first.
| Dashboard signal | Member lens | What you approve |
|---|---|---|
| A metric improved | Otto | Whether the explanation holds |
| A movement touches the plan | Fugger | Whether the plan changes |
| A risk was flagged | Otto and Roma | Owner and urgency |
| A customer pattern appeared | Roma | The follow-up before it sends |
Why this compounds
The readout does not evaporate after Monday. The reasons behind each movement land in Brain, connected to the accounts, projects, and decisions they touch. Next quarter, when someone asks why activation jumped in July, the answer is one question away, with the original evidence attached.
Use-case FAQ
How is this different from a normal dashboard?
A chart shows that a number moved. Boord's readout says what moved, the most likely reason, whether it is fragile, and the question a leader should answer about it, with follow-up attached.
Where do the numbers come from?
From connected tools, uploaded files, or notes you paste into chat. Boord keeps the source next to the reading, so you can always check how a number was produced.
Can the dashboard be wrong?
Any reading can be. That is why each claim carries its reasoning and its source, and why the review ends with a human deciding what to act on. Boord makes the judgment inspectable, not automatic.
Who uses the readout after the leader?
The same narrative feeds the weekly review, the project board, and customer follow-up, so one reading moves the whole operating loop instead of dying in a slide.